Chart Patterns vs. Candlesticks Patterns
Every trader needs to have a trading system. It is a set of rules you follow before, in, and after every trade. One of the critical parts of the trading system is a reason for you to enter or exit the trade. In this article, we will guide you through these reasons.
Chart patterns are on one side, and candlesticks are on the other. Who will win?
Key takeaways
- Both chart patterns and candlesticks are technical tools for traders. They help in finding a trade direction and managing risks.
- Candlestick patterns have fewer candles, but they can often confirm a trader's thoughts.
- Chart patterns have more candles and can offer a more significant trend indication, but they require patience and experience to identify.
- A clear trading system with specific entry and exit rules is crucial for successful trading, regardless of the methodology used.
- Traders should consider combining chart and candlestick patterns for a more well-rounded trading strategy.
Types of candlesticks patterns
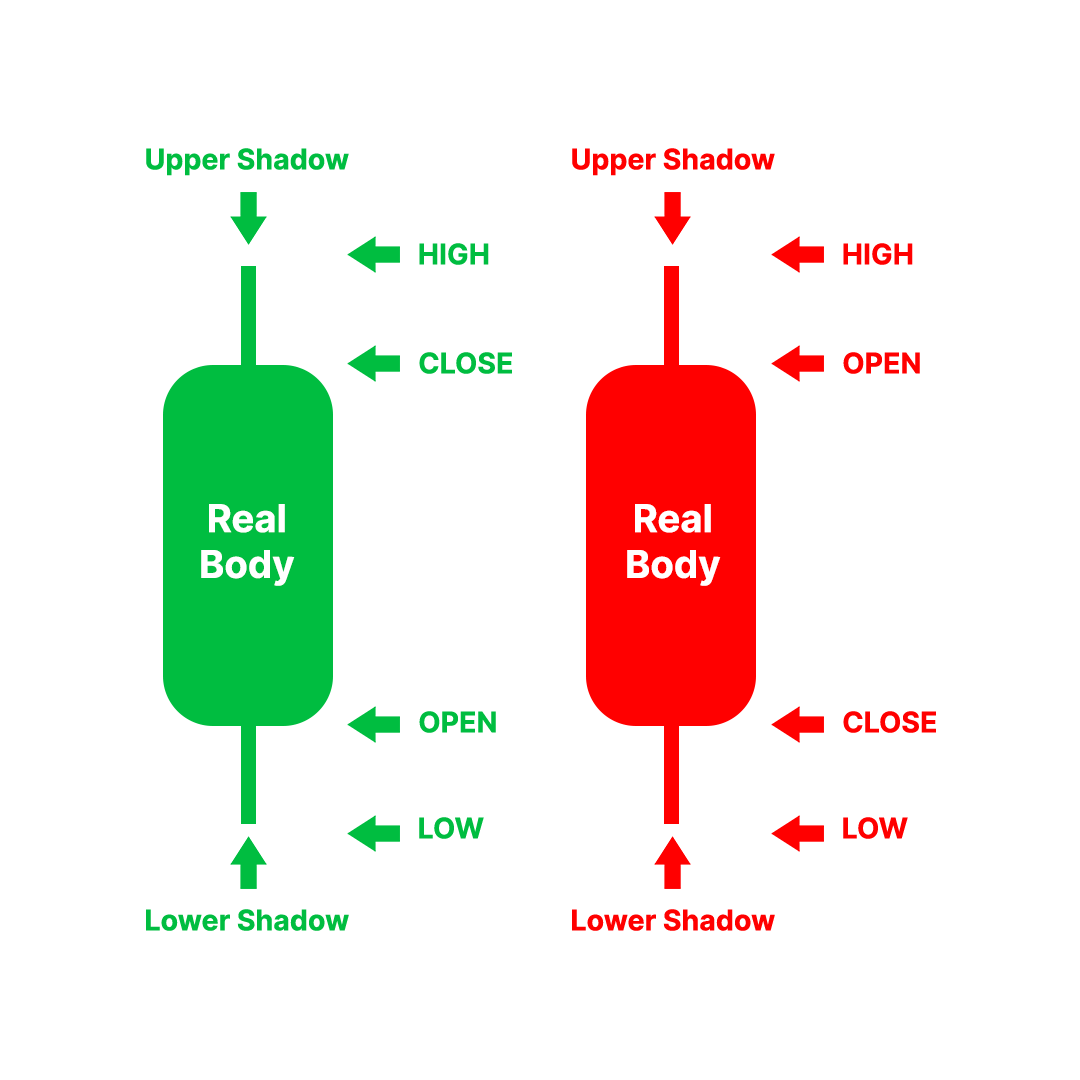
Every candle consists of several parts. It has a real body and two shadows. Thanks to the Japanese candlesticks, we can read the market movements, including the price at the beginning and the end of every trading period. Read more in the complete Japanese candlesticks guide. Let’s now look at different candlestick patterns.
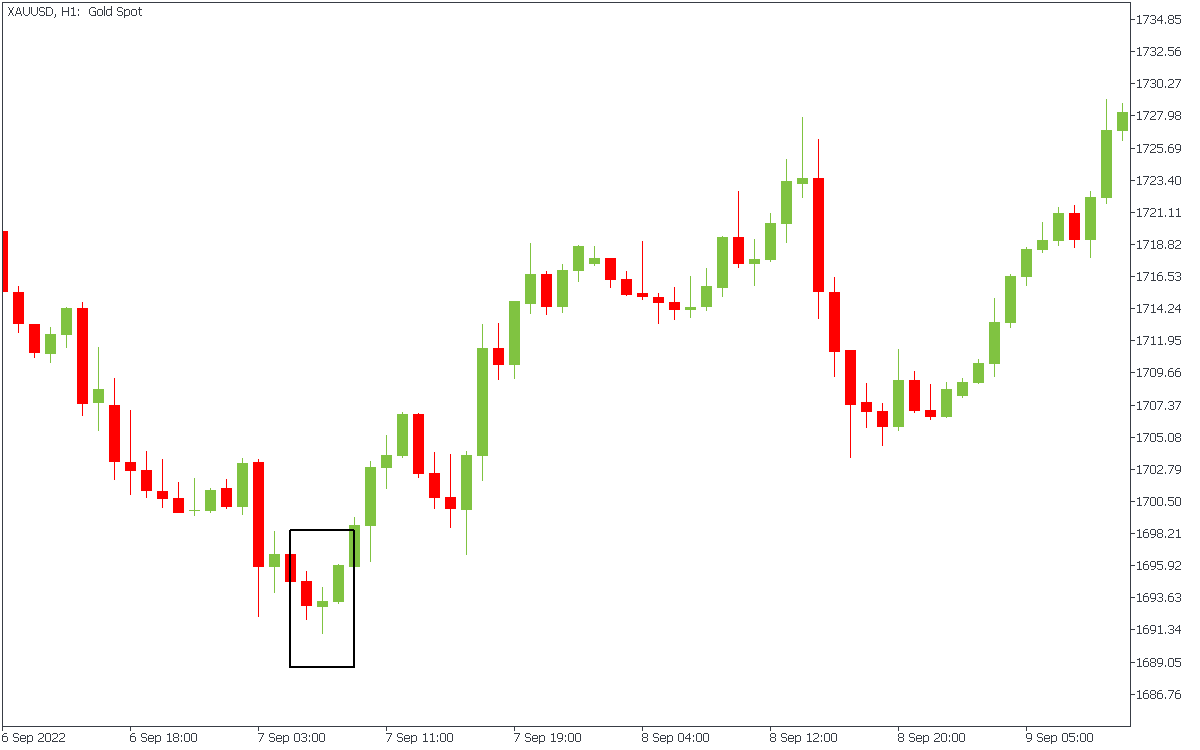
Hammer
Hammer is a bullish candlestick pattern that indicates a potential trend reversal. The pattern consists of a candle with a small body and a long lower shadow, suggesting that buyers could push the price up after a period of selling pressure.
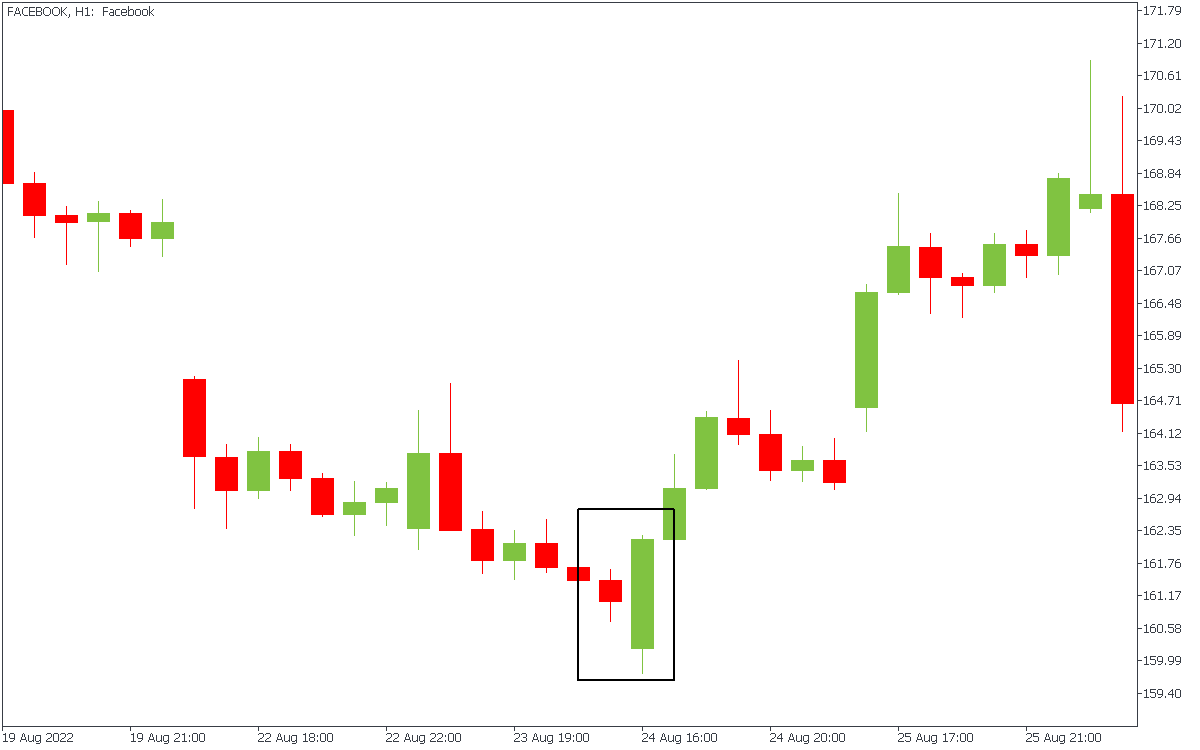
Bullish Engulfing
This bullish reversal pattern occurs when a larger green candlestick completely engulfs a small red candlestick. The second candle should start below the shadow of the first one and end above its highest point. The pattern tells us that buyers took control of the market.
Morning Star
Morning Star is a bullish reversal pattern consisting of three candles. The first is a long bearish candle, followed by a small candlestick, and then a long bullish candle. The pattern suggests that a trend reversal is imminent. Note that the middle candle usually has short bodies and shadows, showing that bulls and bears failed to push the price.
Also, traders watch for gaps in price to confirm the pattern.
Hanging Man
This is a bearish reversal pattern at the top of an uptrend. The candle has a small body and a long lower shadow, suggesting buyers could not sustain the upward momentum.
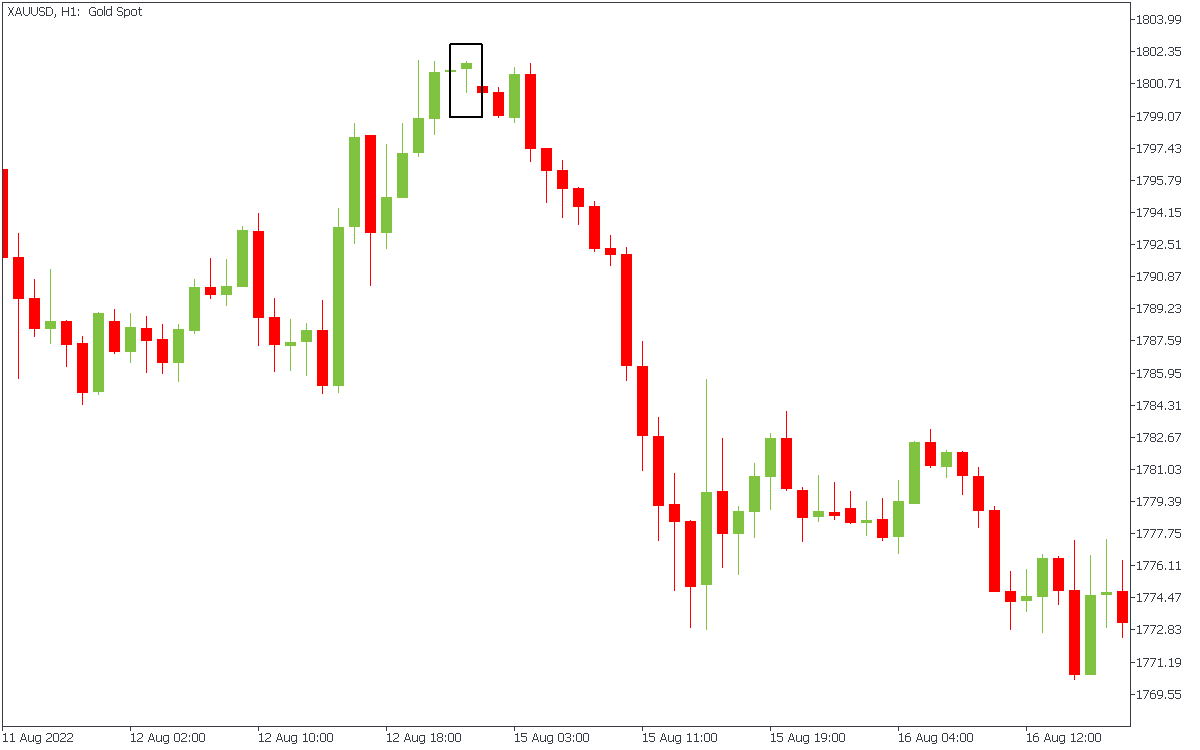
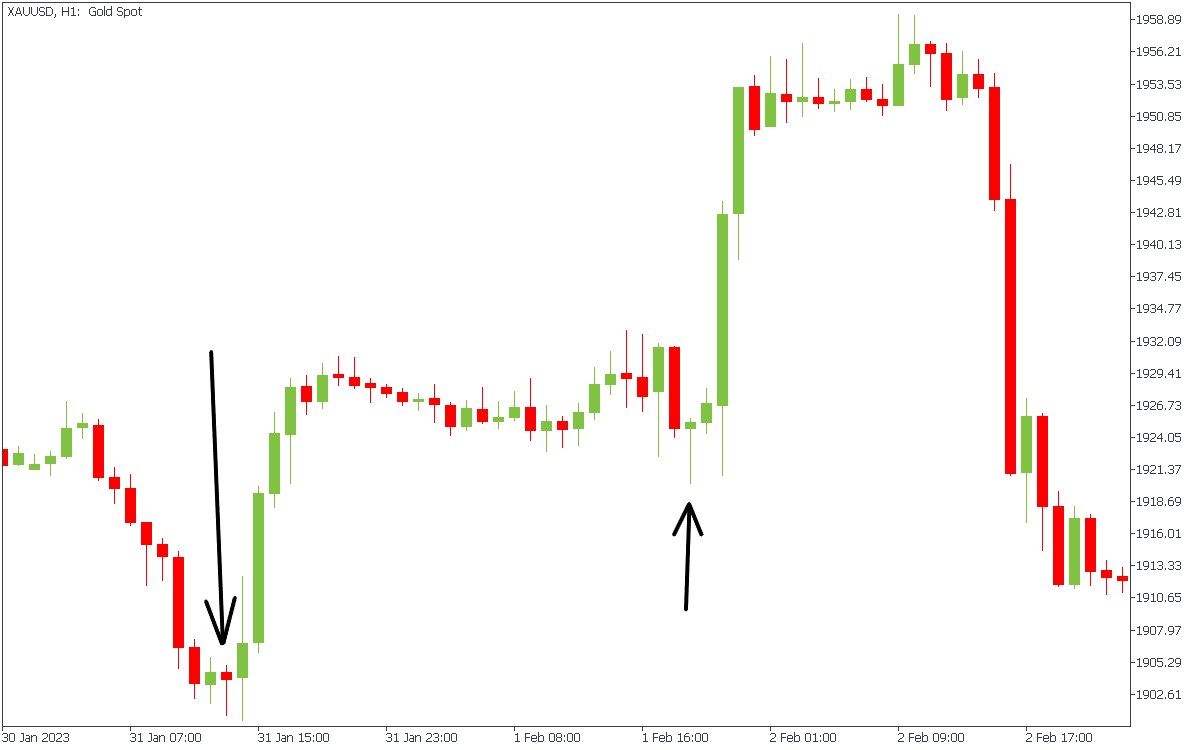
Shooting Star
This reversal pattern occurs at the top of a movement. The pattern is characterized by a small body and a long upper shadow, suggesting that sellers could push the price down after a period of buying pressure.
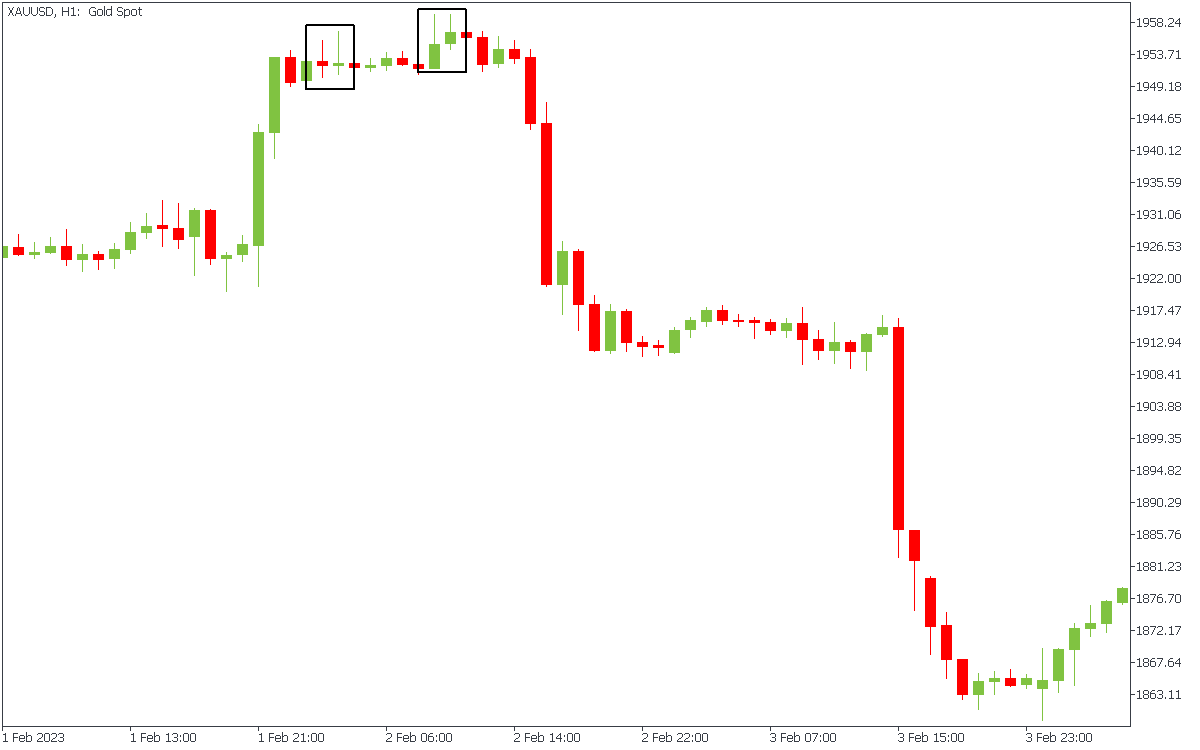
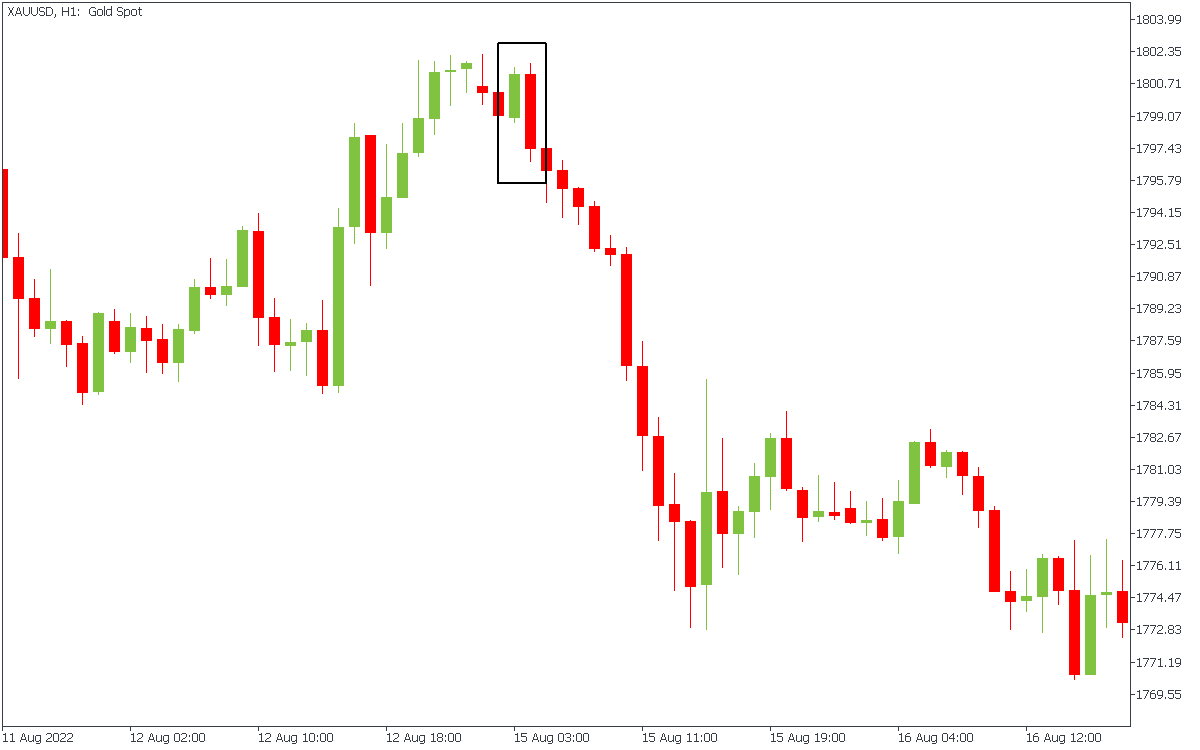
Bearish Engulfing
A bearish reversal pattern occurs when a larger red candlestick completely engulfs a small green candlestick. It looks entirely like a bullish engulfing pattern with the candles switched. The first is a green candle, and the second is red. Usually, sellers enter the game after the bearish engulfing pattern finishes.
It is way more efficient when you see several reversal candlestick patterns in a row. For example, in the figure above, the bearish engulfing appeared after two shooting stars, confirming the upcoming downtrend.
Chart patterns
Unlike candlestick patterns, chart patterns take more time to form. For example, when bearish engulfing occurs, you need only two candles to assess the situation. On the other hand, a chart pattern takes at least ten candles. Here, we collected different chart patterns for you.
Continuation patterns
Triangles
This is a continuation pattern that forms when the price movements are contained within two converging trend lines. A breakout in either direction suggests a continuation of the prior trend. There are three types of triangles:
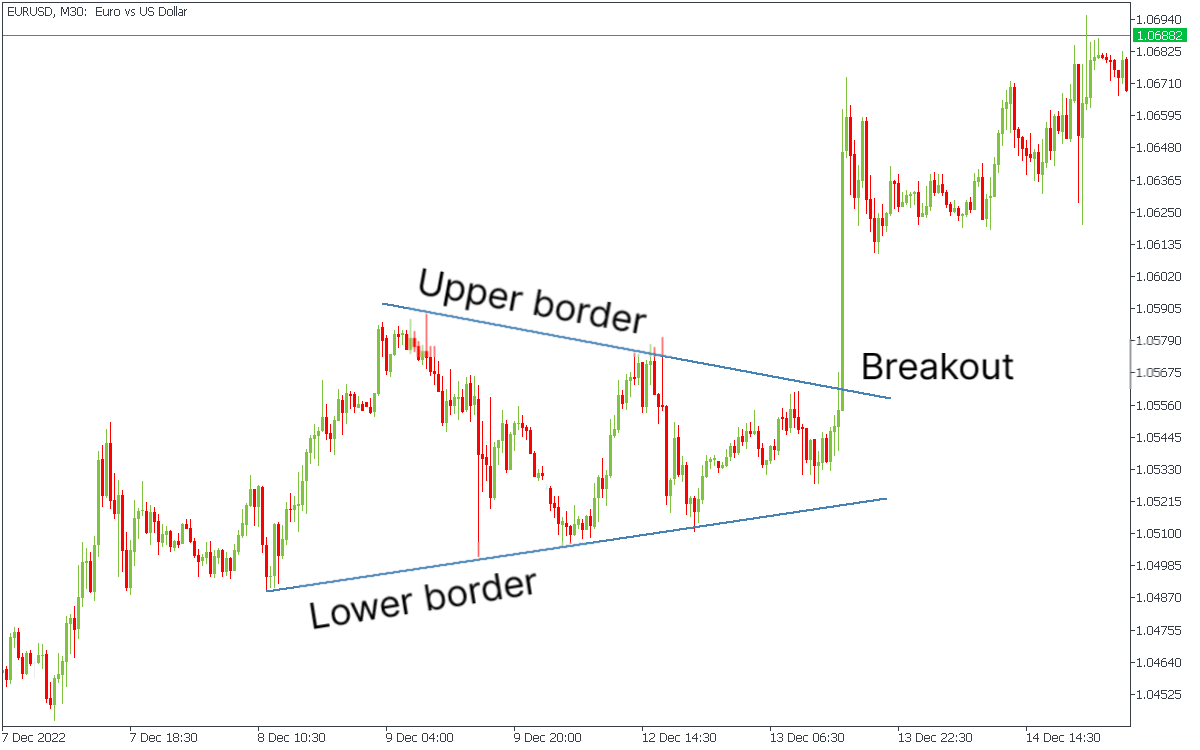
- Symmetrical: A triangle pattern characterized by a series of lower highs and higher lows. The pattern suggests that the market is indecisive, and a breakout may happen soon. Traders usually consider this neither a bullish nor a bearish pattern. They prefer to enter after the breakout and retest.
- Ascending: A triangle pattern characterized by a flat top trend line and a rising bottom trend line. The pattern suggests that buyers are gradually gaining control of the market. Usually, buyers enter after the breakout and retest the resistance line.
- Descending: A triangle pattern characterized by a flat bottom trend line and a falling top trend line. The pattern suggests that sellers are gradually gaining control of the market. Usually, sellers enter after the breakout and retest the support line.
On the chart below, you can see a symmetrical triangle.
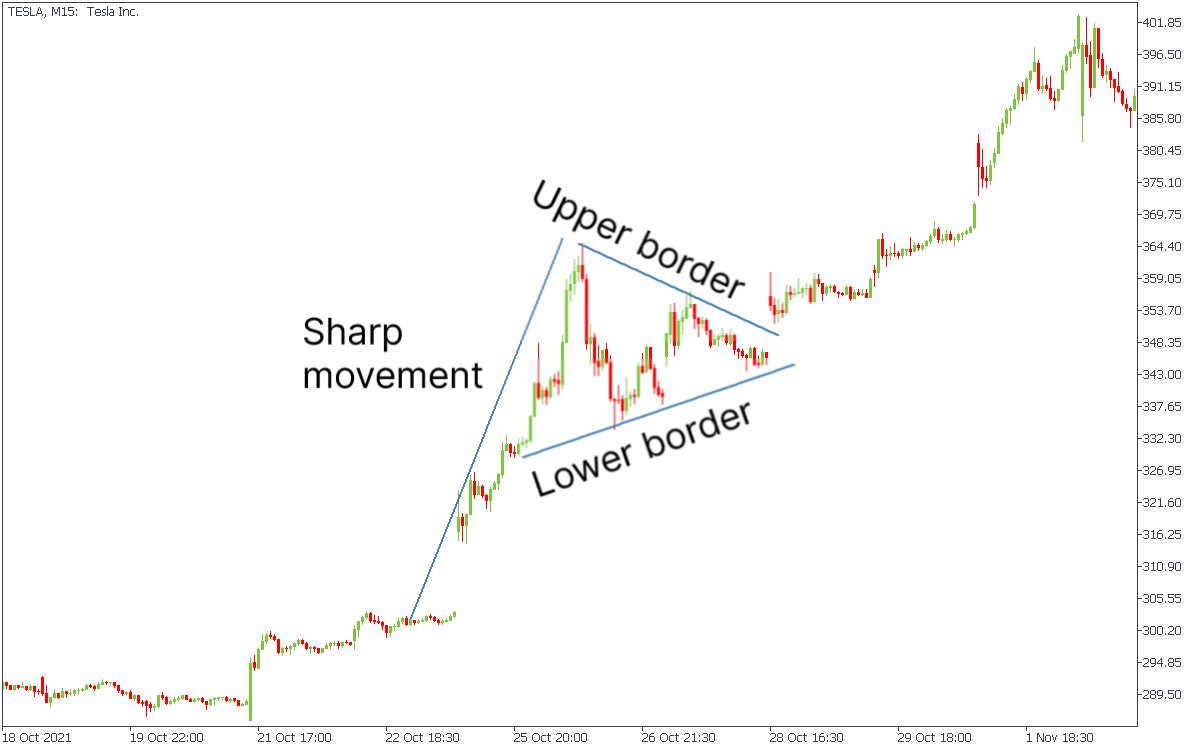
Pennant pattern
This continuation pattern forms when a brief period of consolidation follows a sharp price movement. It resembles a small symmetrical triangle and suggests that the prior trend will continue.
Reversal patterns
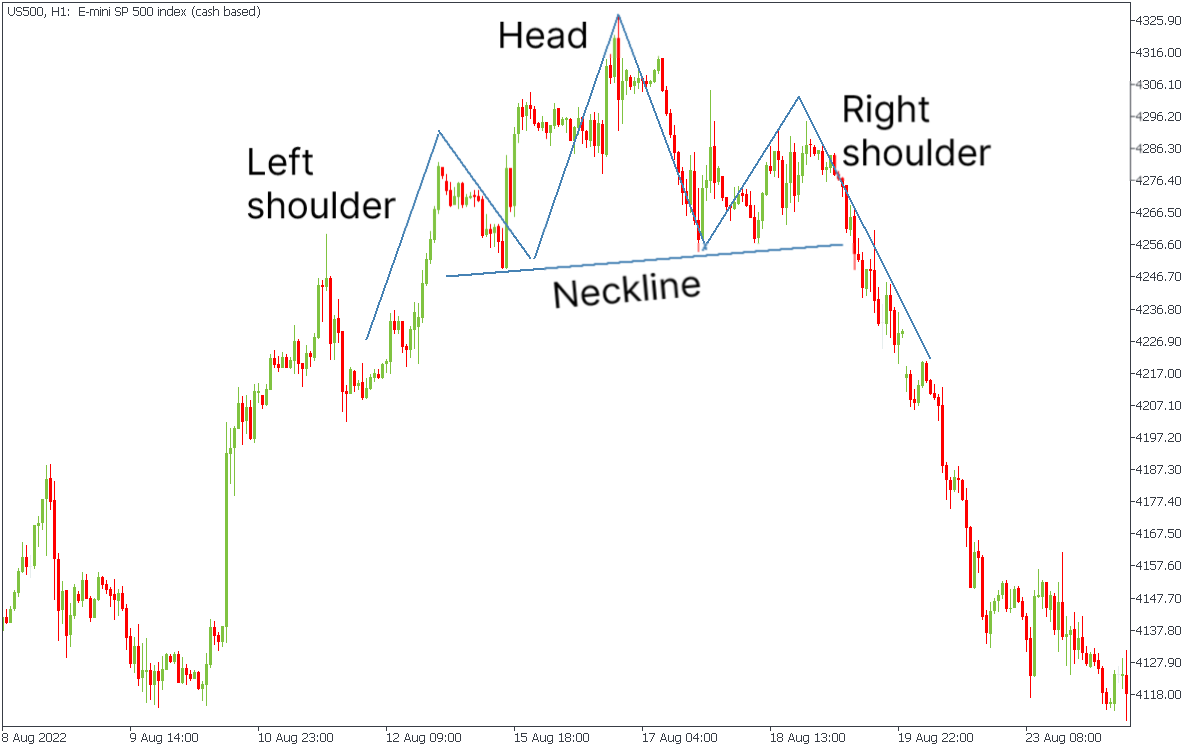
Head and Shoulders pattern
This is a reversal pattern that consists of three peaks, with the middle peak being the highest. The pattern suggests that the market is shifting from an uptrend to a downtrend.
Double Tops and Bottoms
These patterns occur when the price reaches a high or low point twice, with a period of decline or rise in between. A double top or a double bottom suggests that the market may reverse.
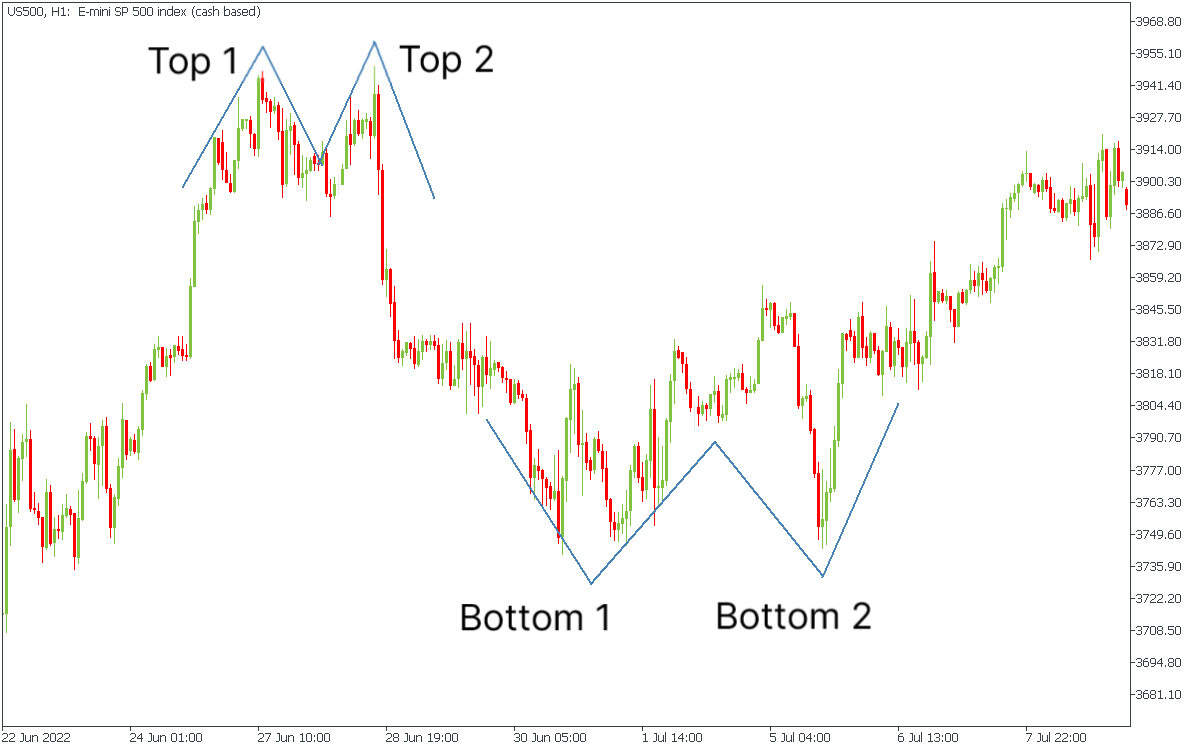
Chart patterns vs. candlesticks: what's the difference?
Here are the main differences between chart patterns and candlesticks:
- Candlestick patterns take fewer candles to form than chart patterns. However, suppose you see a pattern on the M1 timeframe (where one candle equals one minute). In that case, you may find several chart patterns here. Still, it would look like a single candle on a daily timeframe. The timeframe means a lot.
- Candlesticks usually act as a confirmation of your thoughts. We do not recommend trading only with candlestick patterns as they can often occur in the middle of the movement, faking you. Therefore, finding a chart pattern first is better than looking for candle confirmations.
Bottom line
In conclusion, chart patterns and candlesticks are valuable tools for traders to analyze and predict market movements. It is essential to have a trading system and an apparent reason for entering or exiting a trade, whether based on chart patterns, candlesticks, or both. Ultimately, choosing between chart patterns and candlesticks comes down to personal preference and trading strategy.